$5,800 per month: Indigo – Tech Recruiters has researched the salaries of top executives in the Ukrainian IT sector
13 July 14:17
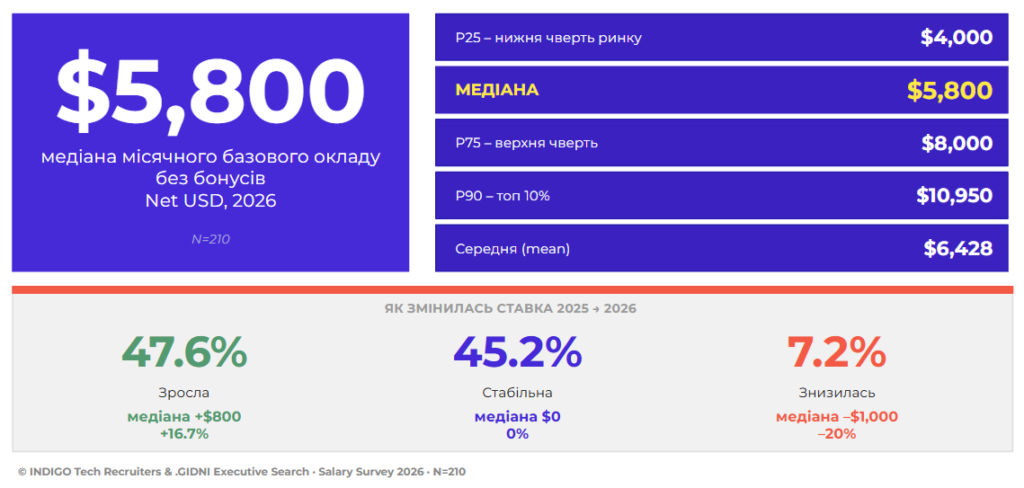
According to a study by Indigo – Tech Recruiters and.Gidni – Executive Search, the median fixed monthly salary for C-level executives in the Ukrainian IT sector in 2026 is $5,800, reports "Komersant Ukrainian".
The survey covered 210 top managers in the Ukrainian IT sector. Despite constant changes in the market, compensation levels remain high, and the gap between roles and companies is becoming increasingly noticeable, the study notes.
“One clarification right from the start. This year, we deliberately shifted the focus of the key figure to the base monthly salary (net), excluding bonuses. This decision was made at the request of our clients and the top managers themselves: it is the salary that employers include in their offers, and candidates cite in their salary expectations,” the analysts reported.
Who Earns the Most at the C-Level
The salary distribution reveals significant inequality in the sector:
- bottom quartile (P25) — $4,000,
- the top quartile (P75) — $8,000,
- top 10% of executives — $10,950,
- the median — $6,428.
The authors of the C-level study emphasize that it is incorrect to directly compare the 2026 median with previous periods due to differences in the sample structure. This is because the sample was drawn from a diverse group of participants in terms of roles, gender, and company type. Last year’s figure was $6,000.
Watch us on YouTube: important topics – without censorship
How to Interpret the Trends Correctly
“The most obvious thing would be to compare $5,800 with last year’s $6,000 and conclude that it ‘has fallen.’ You shouldn’t do this, and the reason lies in the methodology,” the analysts note.
As explained in the study, each year represents a separate, independent sample with a different composition of participants: varying proportions of roles, genders, and company types. Therefore, the aggregate median from one year to the next is not a panel tracking of the same people; these are two distinct cross-sections. Over the long term, such a snapshot provides a reliable picture: $3,500 in 2018 rose to $5,800 in 2026, representing a 66% increase over eight years (2020 and 2023 were years without a study due to COVID-19 and the full-scale invasion). Annual fluctuations of a few percentage points fall within the margin of error of the sample, so it is incorrect to base a narrative on them.
Income trends remain positive but uneven for most:
- 47.6% of respondents reported a salary increase—by an average of 16.7%,
- 45.2% remained at the previous level,
- 7.2% even experienced a decrease in income.
“Therefore, overall, the market is not showing general growth, but rather a selective revaluation of specific roles and specialists,” the study notes.
Salaries by Role in 2026
The highest fixed median salary in IT companies is traditionally held by the CTO (Chief Technology Officer)—$8,000. At the same time, this figure has not changed over the past year.
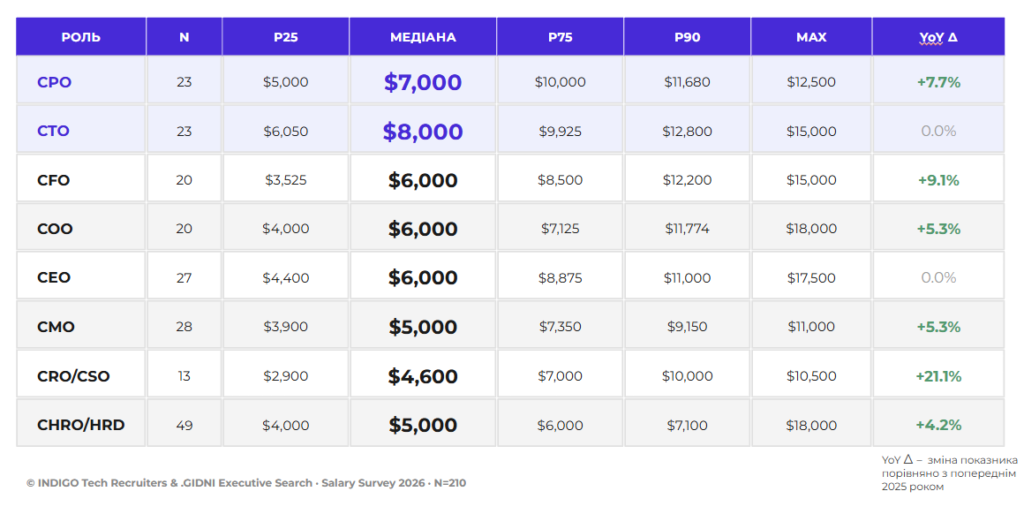
“CROs/CSOs showed the largest annual increase (21.1%): demand for executives directly responsible for revenue is recovering. As for the CTO, the leader in absolute terms ($8,000), their pay has not changed over the past year: the ceiling for high-paying technical roles appears to have been reached,” the study states.
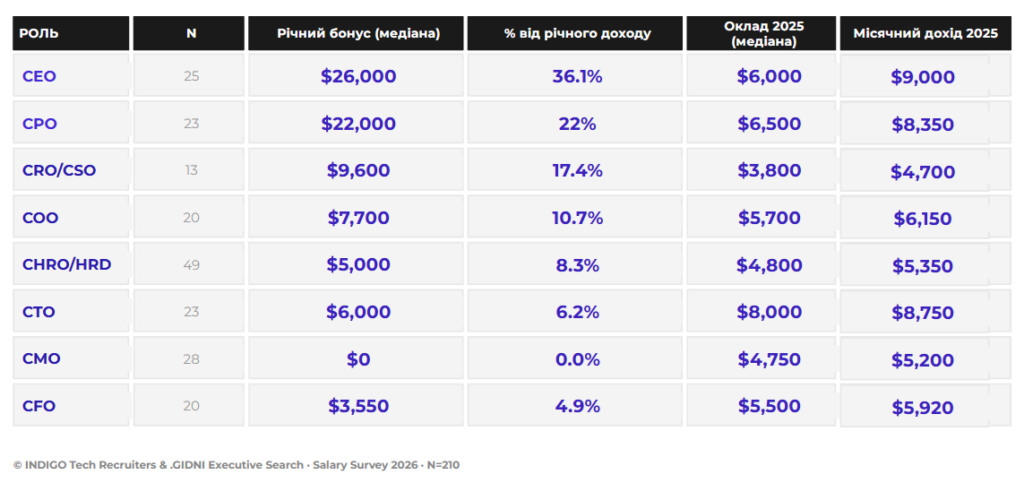
In terms of base salary, the CTO leads the market, but the CEO comes out ahead in total compensation. The reason is bonuses: for the CEO, they account for 36% of annual compensation ($26,000), and for the CPO, 22% ($22,000). In contrast, CTOs have a high base salary but a modest variable component (6.2%), while the median CMO effectively works without a bonus. In other words, the economy of executive and product roles revolves around bonuses.
The company matters more than experience
As analysts note, the company one works for matters more than years of experience. The company’s structural characteristics proved to be stronger predictors of salary than the personal characteristics of the executive.
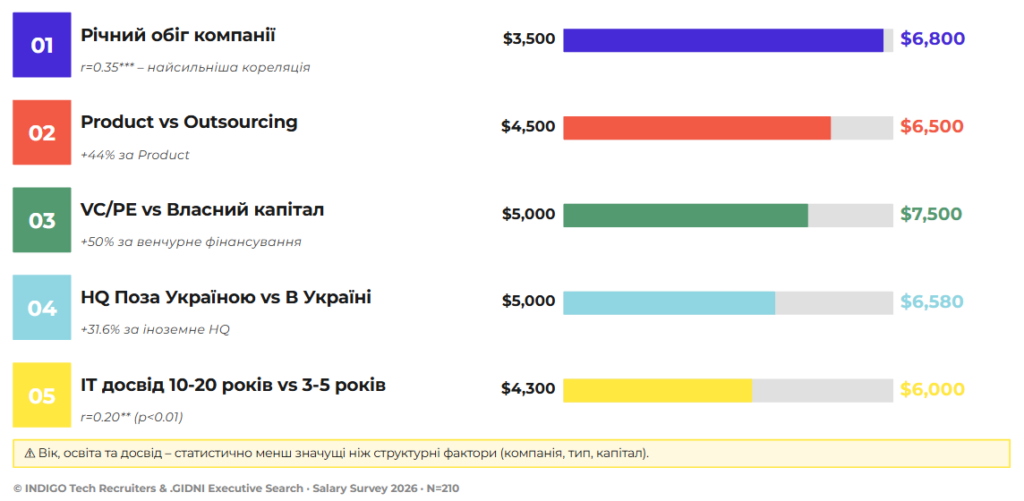
“The strongest statistical correlation is with the company’s annual revenue (r=0.35, p<0.001). Top executives at companies with $100M in revenue have a median salary of $7,250, which is 142% higher than at companies with revenue up to $1M ($3,000),” the study states.
Next in terms of influence:
- Product vs. outsourcing: product companies pay 44% more ($6,500 vs. a median of $4,500). This has been a consistent trend since 2021.
- Venture capital funding: Companies backed by VC/PE capital pay 48% more ($7,500 versus $5,075 for companies funded by equity).
- Foreign headquarters: 32% above the median, regardless of where top IT executives physically live.
“Education accounts for only indicative differences; experience correlates weakly (r=0.20). In other words, a company’s characteristics (type, funding, jurisdiction) have a stronger impact on compensation than years of experience listed on a resume,” the analysts note.
The Founder’s Paradox
According to the study, hired CEOs have a median salary of $7,750 per month, which is 55% higher than that of founder-CEOs ($5,000). It would seem that founders are underpaid. But if we look at total annual income for 2025 (salary plus all actual payments received), the medians are nearly identical: $108,000 for founders (N=15) versus $110,500 for hired CEOs (N=10). The difference falls within the margin of error.
“Founders deliberately keep their fixed salaries low and balance their income through variable components: bonuses, dividends, or other payments. The exact nature of this compensation cannot be identified from the available data,” the analysts explain.
Loyalty Is Not Financially Rewarding
As noted in the study, top executives with up to 1 year of tenure at the company have a median salary increase of 8.3% per year, and 55% received a raise. Meanwhile, executives with 5 years of tenure have a median year-over-year (YoY) increase of 0%: only 38% received a raise, while the remaining 62% are earning the same rate as a year ago.
“The conclusion is clear: market-based compensation adjustments occur at the time of transition, rather than accumulating within the company over time.”
It’s also interesting that 59.5% of the participants themselves consider 3–5 years in a single position to be a “healthy” timeframe, while 40.5% have actually been in their current role for longer. The reasons may vary from person to person: stability during wartime, job satisfaction, or loyalty to the team.
Gender Gap
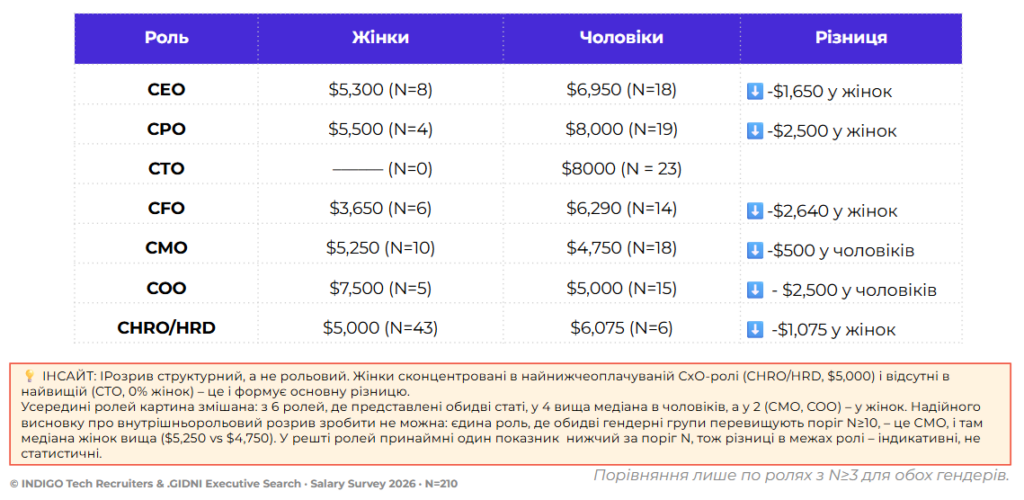
As the study notes, the data reveals that the gap is primarily evident in the distribution of roles: women are concentrated in the lowest-paying CxO role (CHRO/HRD, median $5,000) and are almost entirely absent from the highest-paying ones (CTO, 0% in the sample). We cannot reliably verify the gap within the same role—that is, whether women and men are paid differently for the same work—because in most roles, the number of women or men is below the threshold of N≥10.
“An important nuance: ‘structural’ does not mean ‘gender-neutral.’ The fact that women are concentrated in ‘humanities’ roles and men in technical ones, and that the former are generally paid less, is in itself a gender phenomenon that takes shape long before the C-level: through access to technical education, role models, caregiving expectations, and the cultural undervaluation of “women’s” work.”
As the study explains, the data capture the outcome of this process, but not its causes.
“Therefore, we do not claim that ‘this is pay discrimination’ or that ‘this is simply a matter of free choice’—both statements go beyond what the sample shows,” the analysts explain.
Within the roles, the picture is mixed: of the 6 roles where both gender groups are represented, men have a higher median in 4, while women have a higher median in 2 (CMO and COO). However, as the analysts note, it is impossible to draw a reliable conclusion from this: the only role where both groups exceed the N≥10 threshold is CMO, and there the median for women is even slightly higher ($5,250 versus $4,750)—though this difference in this sample is also within the margin of statistical error. In the remaining roles, at least one gender group falls below the threshold, so the differences within a role are indicative rather than statistically significant.
“We clearly see structural inequality, and it is real. We do not rule out a direct gender factor ‘for the same role,’ but the available data is insufficient for a statistically reliable conclusion. That is precisely why it is important to us that at least 300 male and female executives participate in the study next year (our goal for 2027): a larger sample will allow us not only to formulate hypotheses but also to draw statistically reliable conclusions for each role,” the analysts explain.
Indigo Study
Indigo Tech Recruiters has been researching C-level salaries in the Ukrainian IT sector since 2018. During this period, the average fixed salary rose from $3,500 to $5,800, an increase of 66%. No surveys were conducted in 2020 or 2023 due to the COVID-19 pandemic and the start of Russia’s war.
This year’s study included 210 top managers who answered 42 questions about salaries, bonuses, motivation, and career decisions. The sample is targeted and includes respondents from the Indigo and .Gidni networks as well as partner IT communities; therefore, it is not representative of the entire market. All data is based on participants’ self-reports.
Read us on Telegram: important topics – without censorship